
Role
Visual Designer
Team
Solo
Duration
3 weeks
Tools
Figma, Excel, Tableau & Tableau Public
Overview
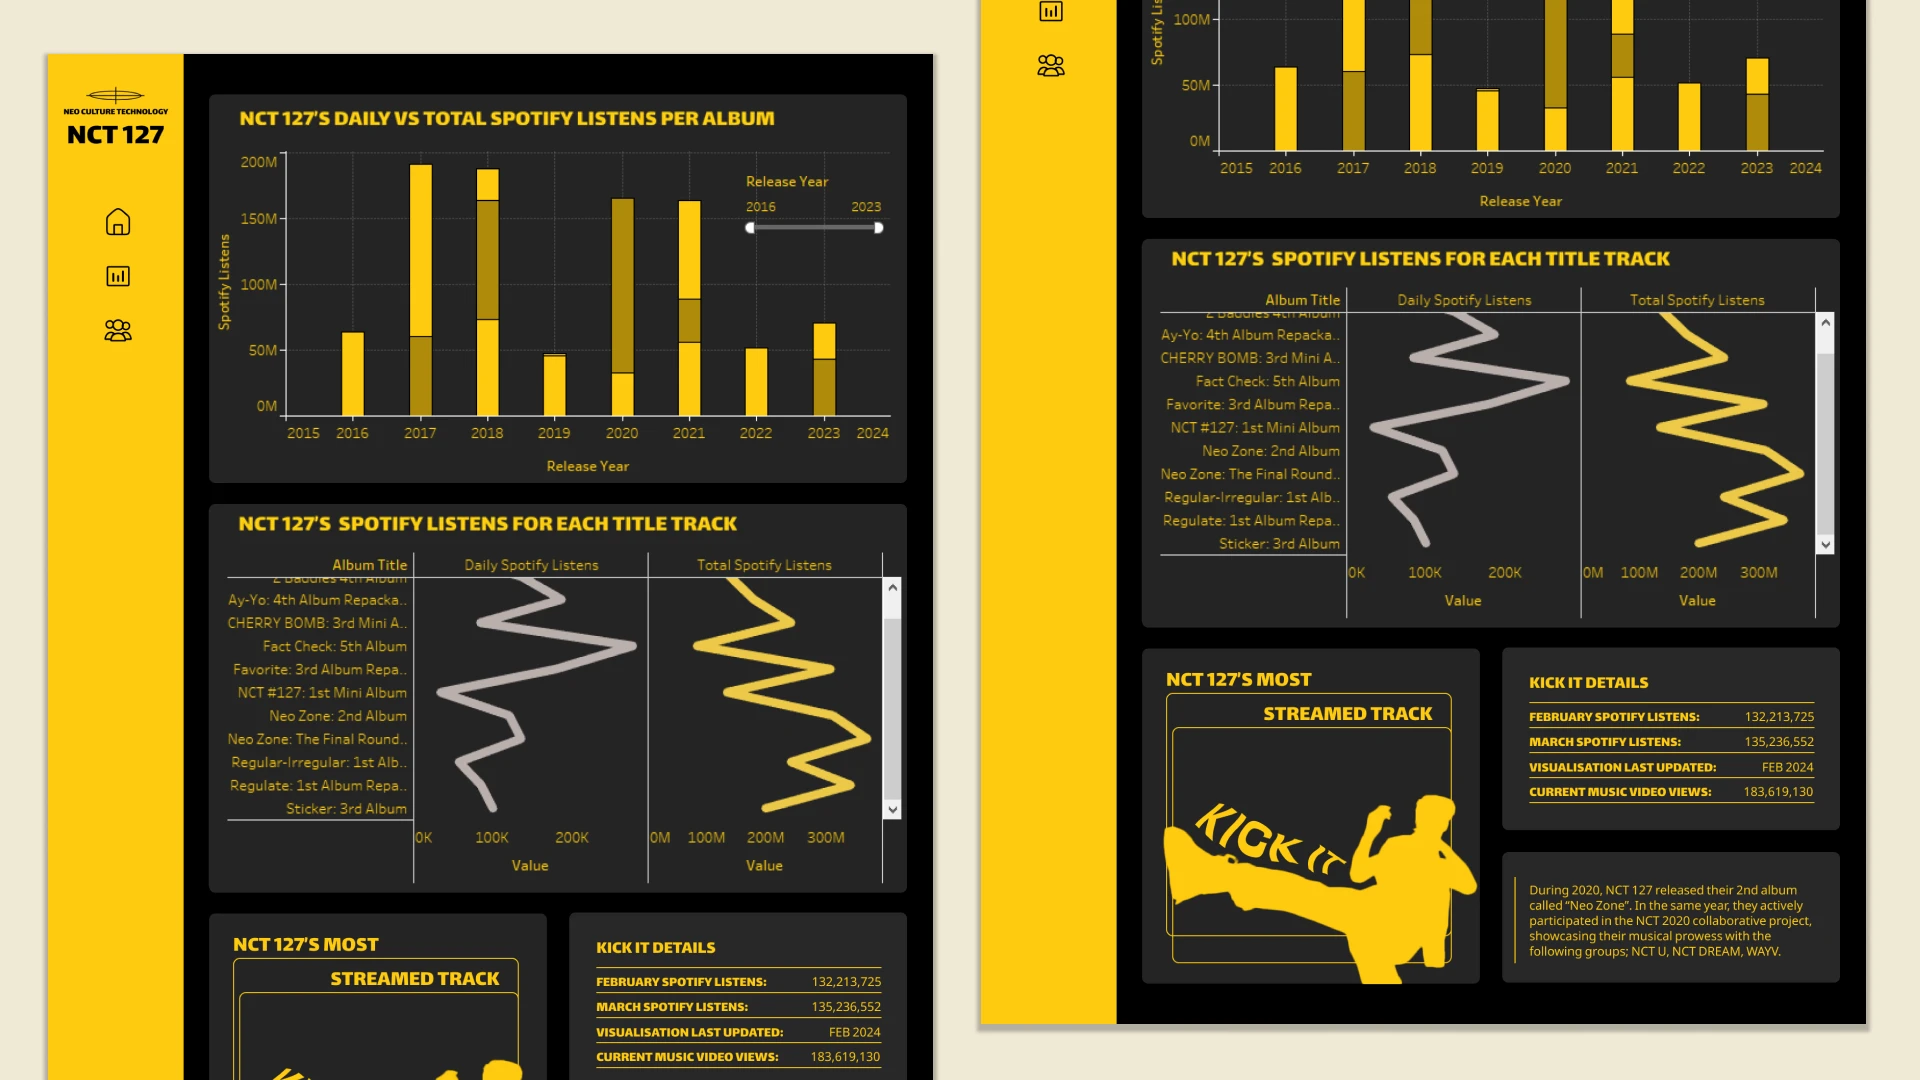
This dashboard is a product of my analysis of the K-pop group NCT 127 and their streaming data on Spotify. As a long-time fan, I aimed to merge NCT's vibrant aesthetic with clear, engaging data visuals that reflect their artistic influence and popularity.
Purpose
The dashboard offers dedicated fans and newcomers a chance to dive into NCT 127's music and impact. Drawing inspiration from their album 'Neo Zone' and its title track 'Kick It,' the platform combines data visualizations with the band's aesthetic. This approach deepens users' insights into NCT 127's Spotify trends and strengthens their connection to the band's artistic achievements.


Art Direction
Given that NCT 127's 'Kick It' significantly influenced the aesthetics, I opted to add their sophomore album, 'Neo Zone,' to guide the artistic vision. This approach allowed me to adapt to the style while introducing new ideas to visualize their Spotify listen data.


Data Collection
Here are some of the pain points I analyzed in Genshin Impact before I conducted the research.


